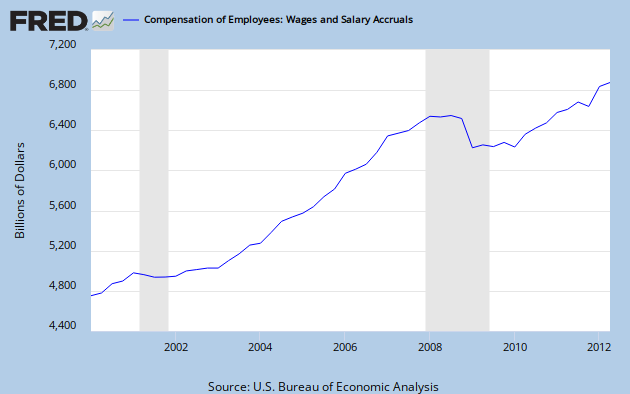
Why did total wages fall? Let's add another line, total number of (nonfarm, seasonally adjusted) employees:

Care: the scale of the red line is on the right hand side. Total wages fell because income fell. Let's verify this by looking at wages per person, what I'll call "wages," computed by dividing total wages and total employment. What happened?
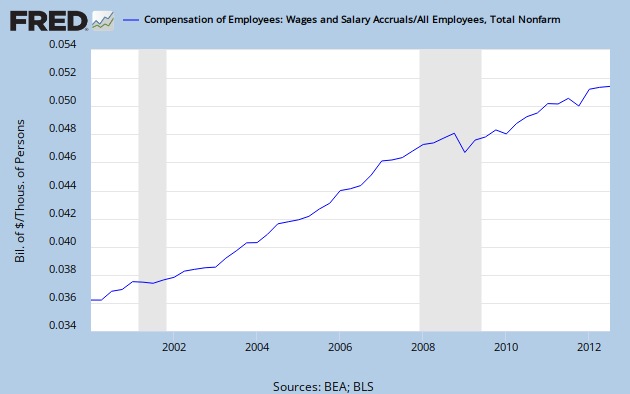
Wages stagnated but did not fall. In other words, wage growth dropped to zero and then the rest of the total wage drop manifested in layoffs. After the recession was over, wages per person picked up right where they left off and continued growing, albeit at a slightly lower rate.
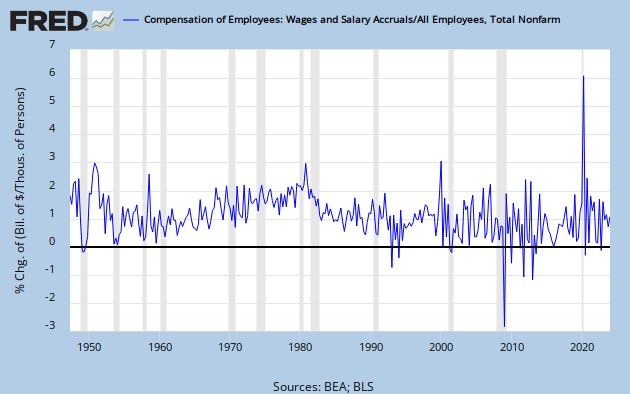
This looks to be a general phenomenon. Here's the whole time series of per-employee wages, from 1939 to 2012, presented as quarter-on-quarter percentage change. Observe that it has dropped below zero precisely four quarters in the last 80 years - and each time it promptly bounced back up. Even during recessions, wage growth keeps rising. These are called "sticky wages."
So what happens in a bad recession? Total income falls and wages fall in proportion. That wage drop manifests itself in a drop in per-employee wage growth to zero, and thereafter people are simply laid off. After the recession is over, wages resume their upward trend.
Let's look at it like this. Total wages are some (more or less fixed) fraction of total income -- roughly half. In a recession, total income falls, so total wages have to fall as well. First, wages stop growing. Then, since wages don't fall and thus don't keep pace with the fall in total wages, people start getting laid off.
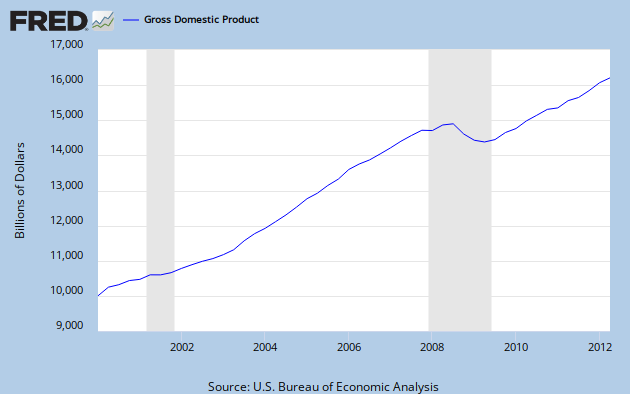
Let's now look at the source of the drop in total wages. Wages fell because income fell: observe that the ratio of total wages to income (green line, right scale) stayed roughly constant over the course of the 2008 recession. Total wages and income are red and blue, respectively, and measured on the left scale.

(As an aside, this constancy was actually a stay in a secular decline; most of the rest of income goes to capital, and income inequality fell drastically during the recession.)
Note that after the fall in incomes, they did not rise back to their initial trend. We can measure potential income, which is what the economy could be producing if it were at full employment, and compare it to actual income:
Unemployment has been persistently high. Why? Wages have continued to grow a little bit more slowly than total wages, and total wages are locked in as a fraction of total income. Thus:
Wages are at a level that produced full employment in 2007, but total income, and hence total wages, are far below that level. The difference is made up in the misery of 5,000,000 people.
Let's examine more closely the relationship between a persistent shortfall in income and unemployment. Let's look at the ratio of actual income to potential income. Here's are the two graphs, one since 2000 and one since 1949. Look at how closely unemployment tracks the income gap:
We should hypothesize that, because of sticky wages, there is a strong positive correlation between this ratio (which I'll call income shortfall or NGDP shortfall) and unemployment. Surprise!
(Data are quarterly, 1949Q1-2012Q2.)
If we look more recently, 2000-2012, we see the same pattern:
In this case, it's tighter because over a mere decade we shouldn't see a large shift in the natural rate of unemployment.
So we see that a sharp shock to income down to a new trend is what causes persistent high unemployment. As Scott Sumner memorably analogized:
NGDP shocks are like a game of musical chairs. Remove 9% of NGDP relative to trend, and you'll have 9,000,000 unemployed workers sitting on the floor. It's that simple.
Wages will slowly adjust downwards (since total wage growth has been greater than wage growth) and labor market hysteresis will reduce the workforce. The former is incorporated in the new income trend, and the both pull potential income down to the new income trend. The economy will return to full employment. But at what cost?
Addendum: There may be some concern that the correlation between income shortfall and unemployment is artificial - that is, that potential income is computed using the unemployment rate, so I'm merely expressing a tautology. For further reading, here is the CBO's explanation of their method for computing potential income.
No comments:
Post a Comment